Sales Rank on Amazon Vendor: Why You Need to Track Your ASIN and Your Competitors
Sales Rank (or BSR, Best Sellers Rank) is one of the most-checked and least-understood numbers on Amazon. A rank that goes up or down tells you nothing on its own unless you also know what the rest of your category is doing at the same time.
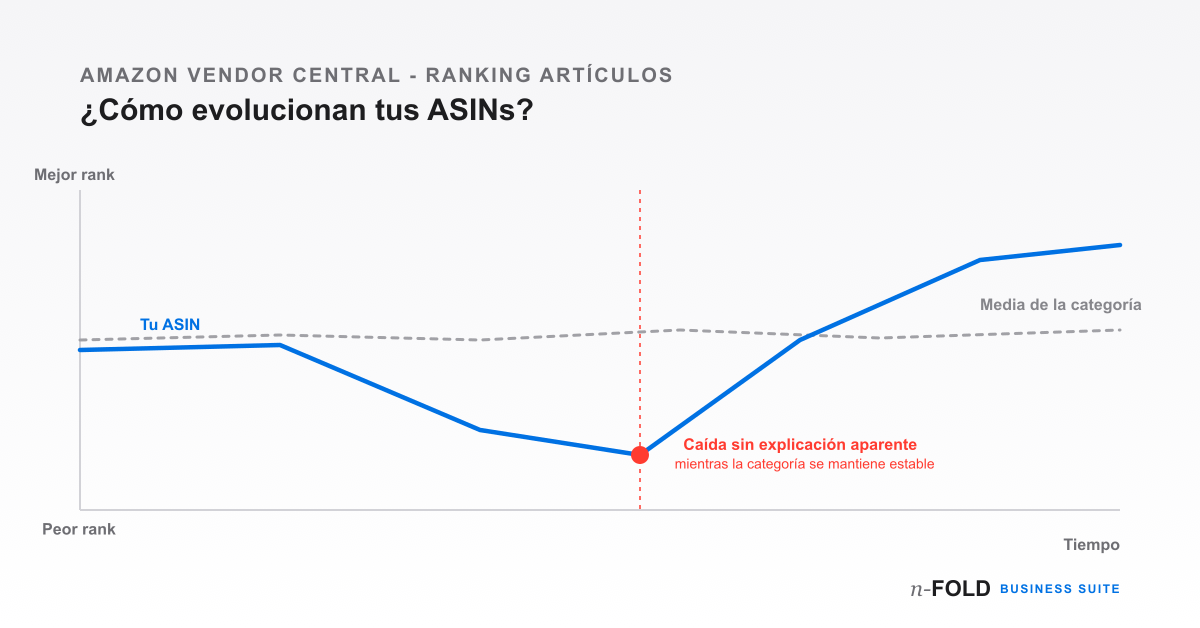
It's common for a team to check a product's Sales Rank, see it's gotten worse, and jump straight to looking for what went wrong — price, stock, ads — without first asking whether the problem is the ASIN's or the whole category's. That question completely changes what the right response is.
What Sales Rank is, and what it isn't
Sales Rank is a product's position within its category based on recent sales velocity, not cumulative volume. Amazon recalculates it very frequently and always compares it against the rest of the products in that same category or subcategory. That's why a Sales Rank of 3,000 in "Home & Kitchen" isn't comparable to a 3,000 in a niche category: the number only makes sense within its own competitive context, and that context is constantly shifting.
Why looking at your ASIN alone isn't enough
If your Sales Rank improves from 8,000 to 5,000, the instinctive read is positive. But if the whole category grew over that same period — seasonality, a sector-wide campaign, or more buyers entering the market — your direct competitors may have improved even more, and in relative terms you could be losing share within your own category without the absolute number showing it. The reverse also happens: a Sales Rank that slightly worsens can be good news if the whole category contracted and you fell less than everyone else.
The only way to know which of the two scenarios applies to you is to compare your ASIN's trend against a set of direct competitors in the same category, not against an isolated absolute number.
The patterns worth watching
- An isolated, one-off dip: usually noise — Amazon recalculates rank very frequently and there's natural day-to-day variation.
- A sustained drop while the category stays stable: a signal of an ASIN-specific problem — a lost Buy Box, a stockout, a recent bad review, or a price change.
- A broad drop across the whole category: usually seasonality or a shift in buyer behaviour that has nothing to do with you.
- A sustained improvement above the category average: confirms that a specific action — a campaign, a price adjustment, a content update — is genuinely working, not just riding a general trend.
Cross-referencing Sales Rank with other signals
Sales Rank rarely explains itself. When it drops consistently, it's worth checking it against that same ASIN's Buy Box status and the stock level available at the time — a lost Buy Box or a stockout usually precedes the rank drop, not the other way round. Looked at together, rather than as standalone metrics, Sales Rank stops being a curious number and becomes an early warning of a problem that can still be fixed.
Tracking your ASIN and your category without checking it by hand every day
Manually comparing your catalogue's Sales Rank against several category competitors, day after day, isn't viable at scale. n-FOLD Business Suite's seller analytics module syncs your ASINs' Sales Rank via SP-API, automatically compares it against the category average, and flags when the divergence starts — before it turns into a sales drop you only see at the end of the week.
Want to know whether your Sales Rank is genuinely improving, or just riding your category?
See the Amazon Vendor moduleThis tracking runs on the same data as Buy Box monitoring and the demand forecasting that Business Suite already syncs.